In today’s edition of the ICP Roundup, we delve into the financial metrics of the Internet Computer, focusing on fees, revenue, earnings, and expenses.
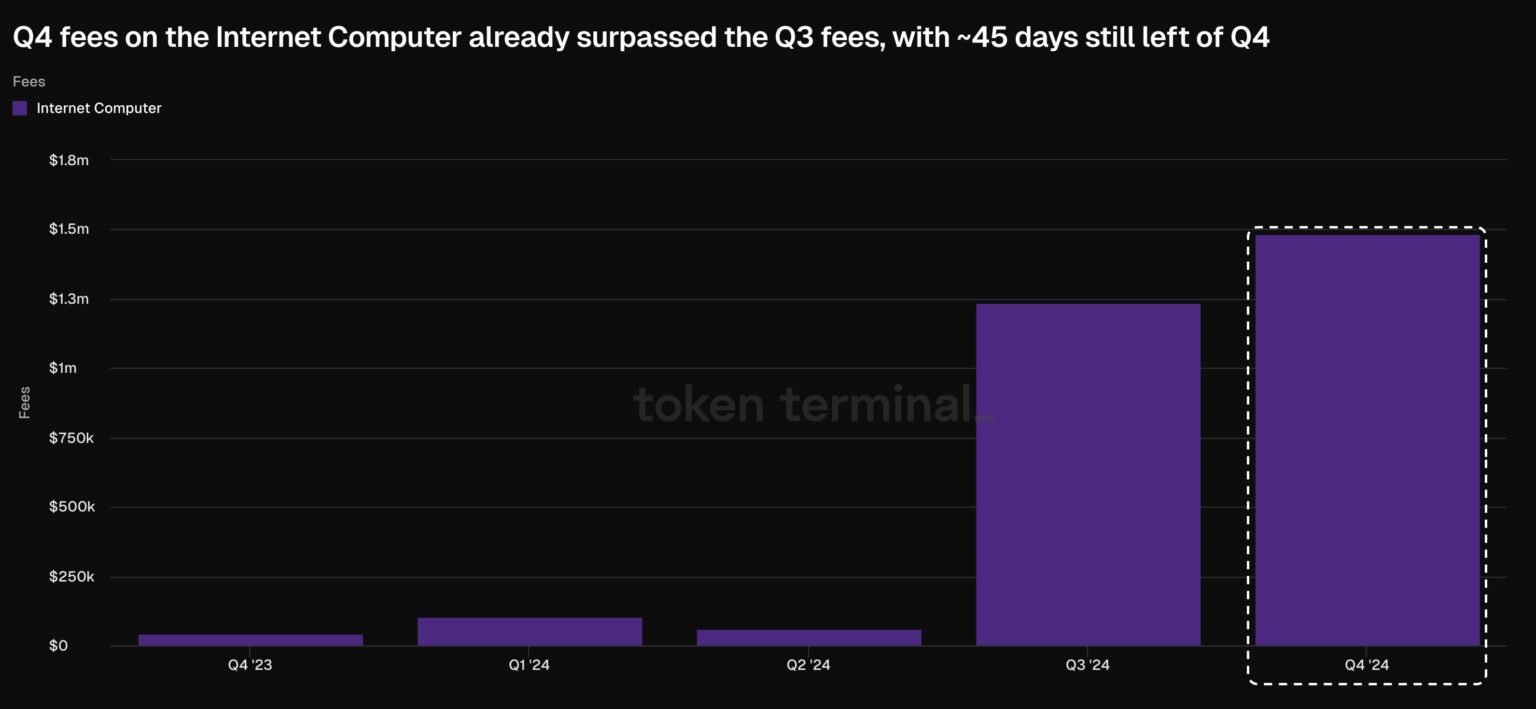
ICP has experienced a significant increase in fees during the fourth quarter of this year, surpassing the total fees collected in the third quarter with approximately 45 days remaining in Q4. This surge indicates heightened network activity and growing adoption of the platform.
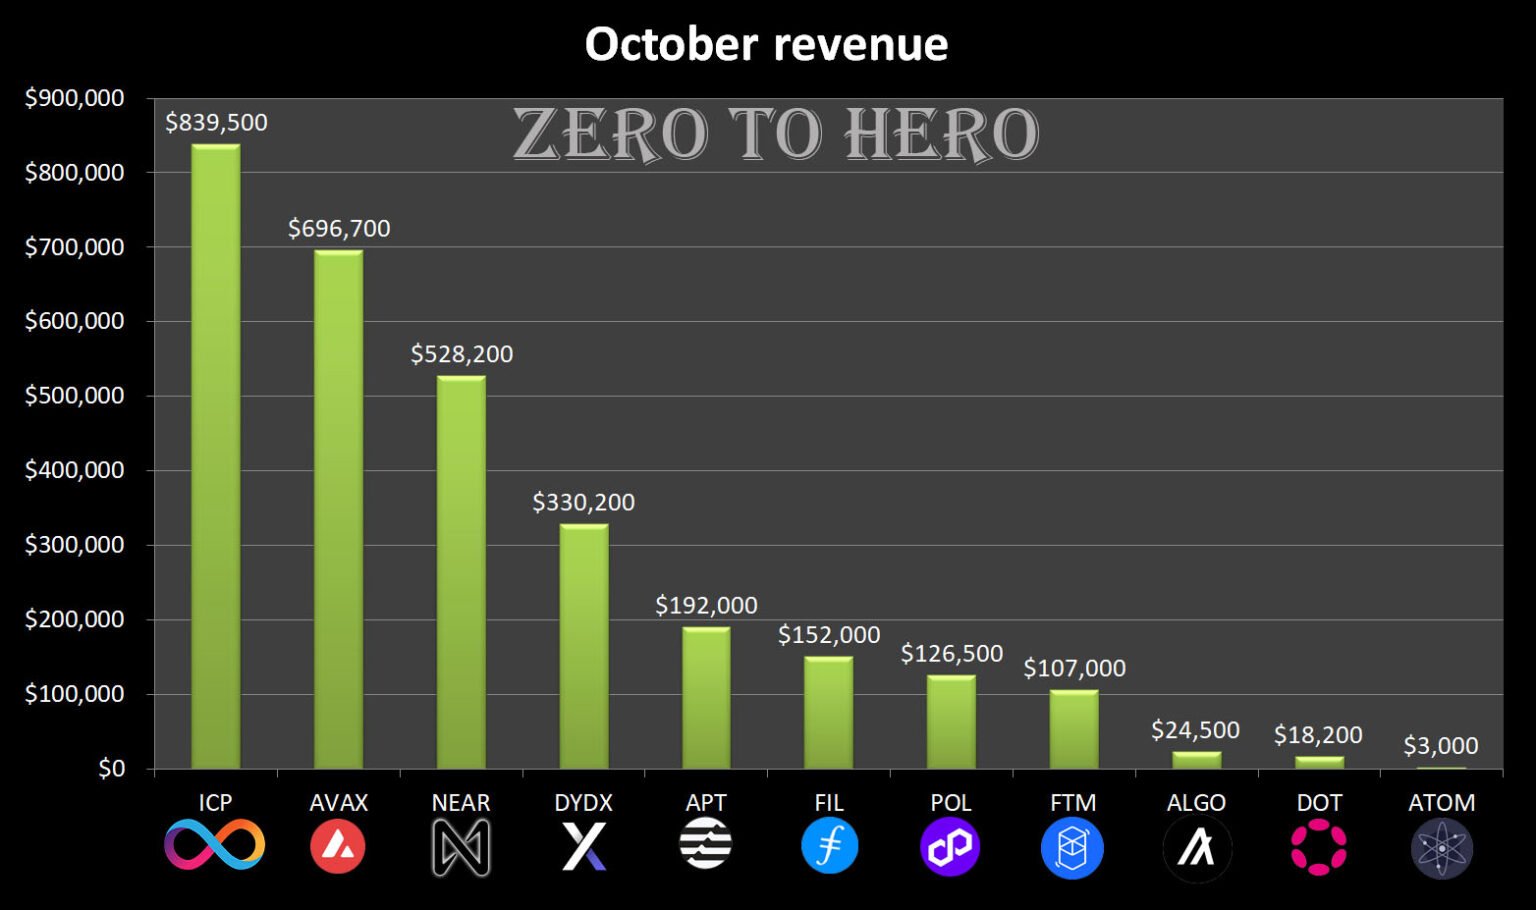
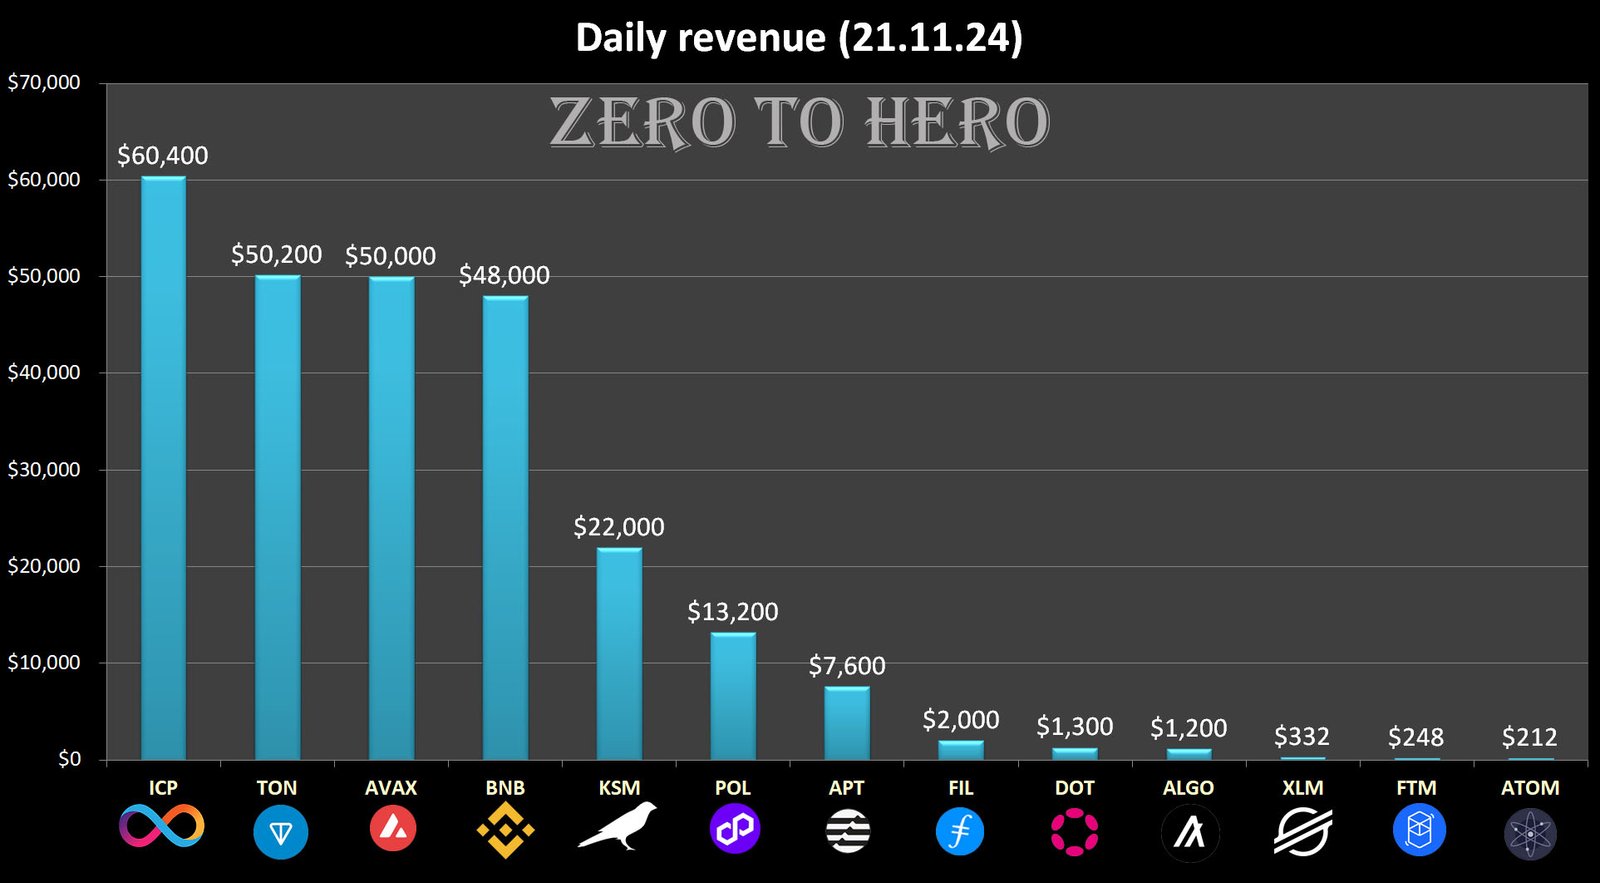
ICP stands out as one of the top-performing Layer 1 protocols in terms of revenue for the month of October (with a market capitalization under $100 billion). The following projects have generated less monthly revenue compared to ICP.
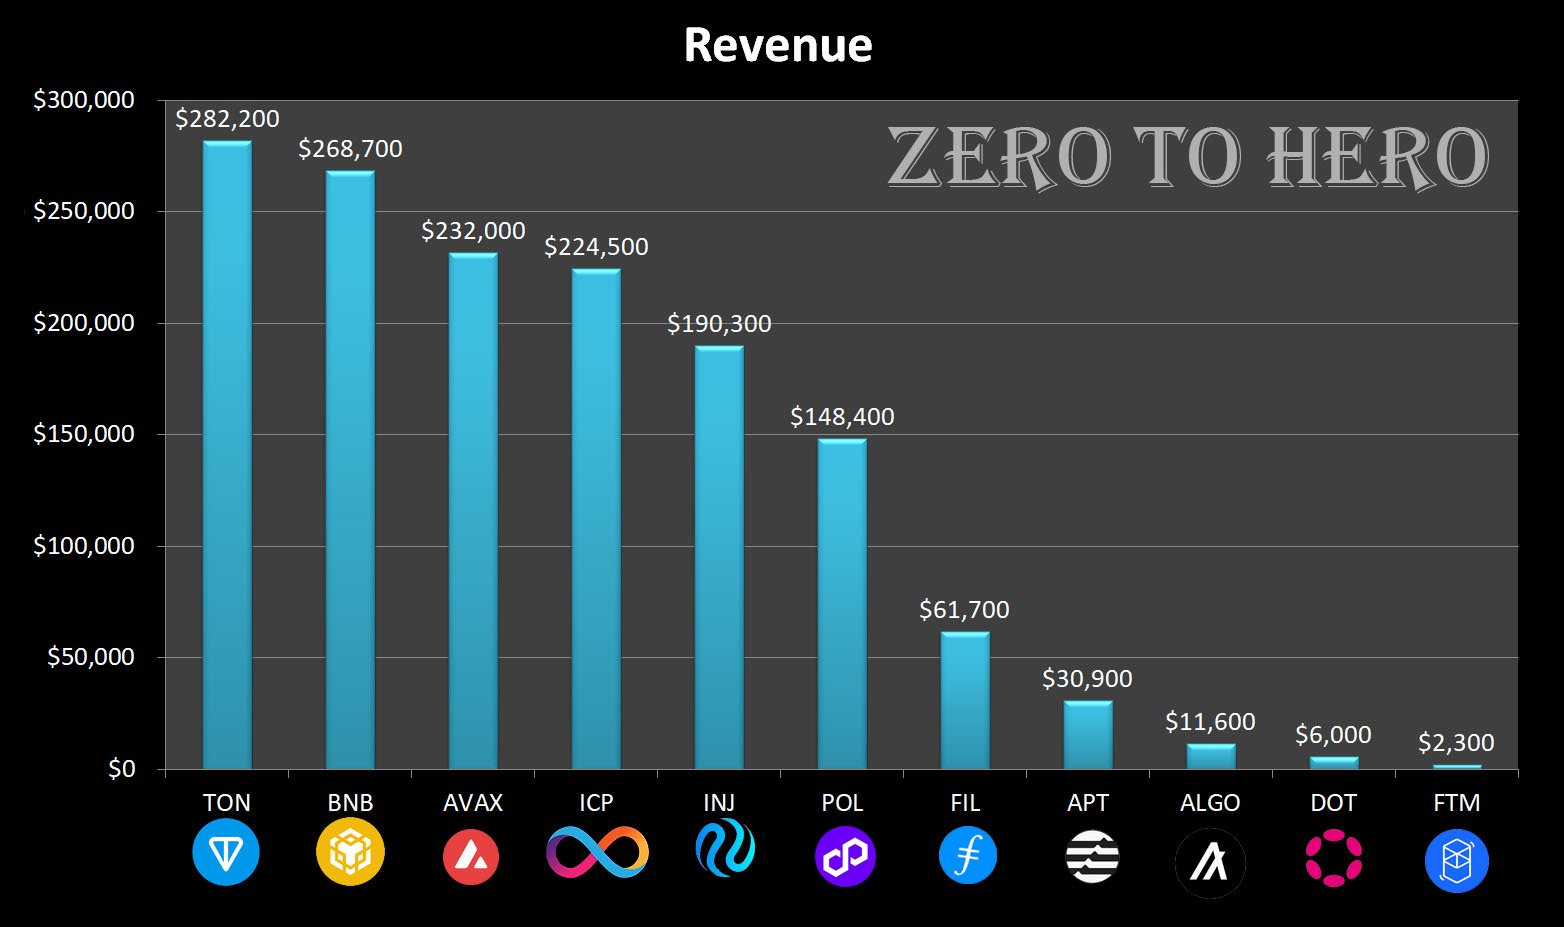
Over the past three weeks, ICP has emerged as one of the top-performing Layer 1 blockchains (with a market capitalization under $100 billion) in terms of revenue generation. Source: tokenterminal
week 1
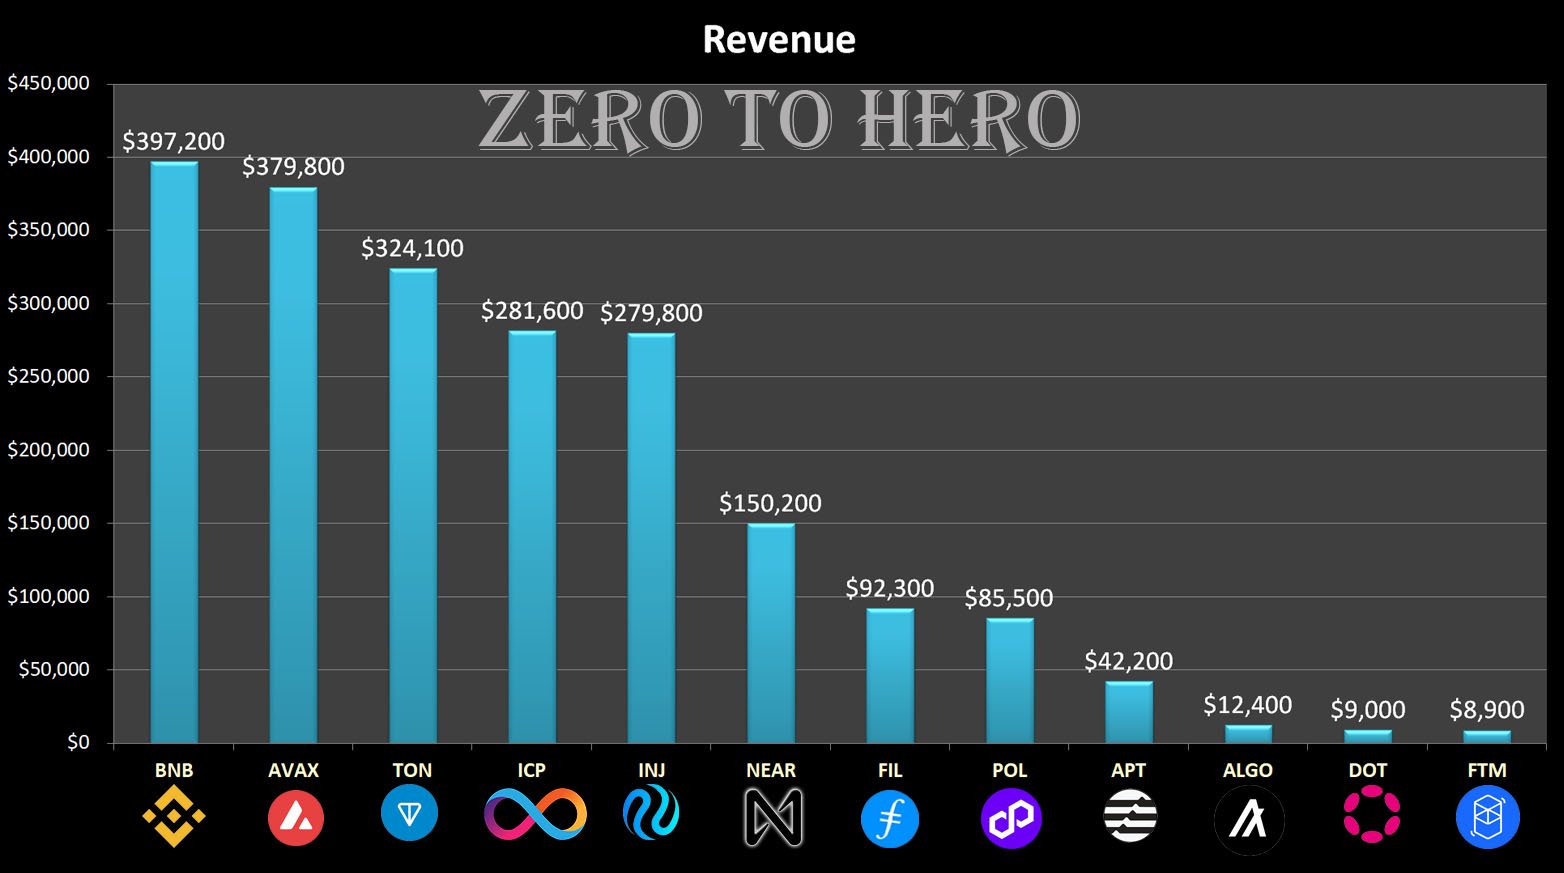
week 2
week 3
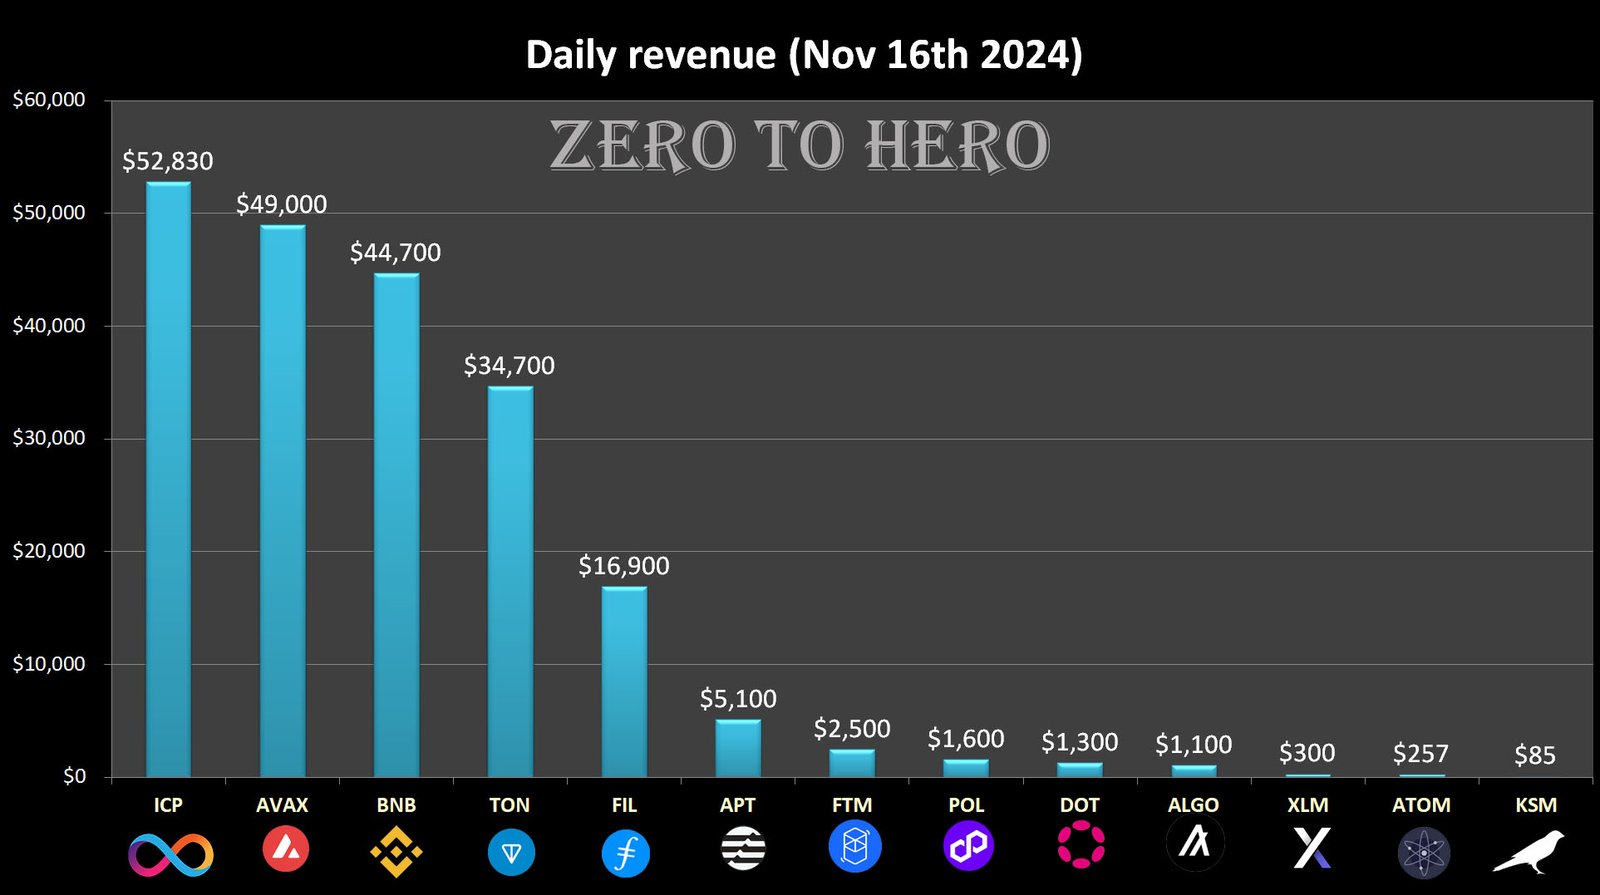
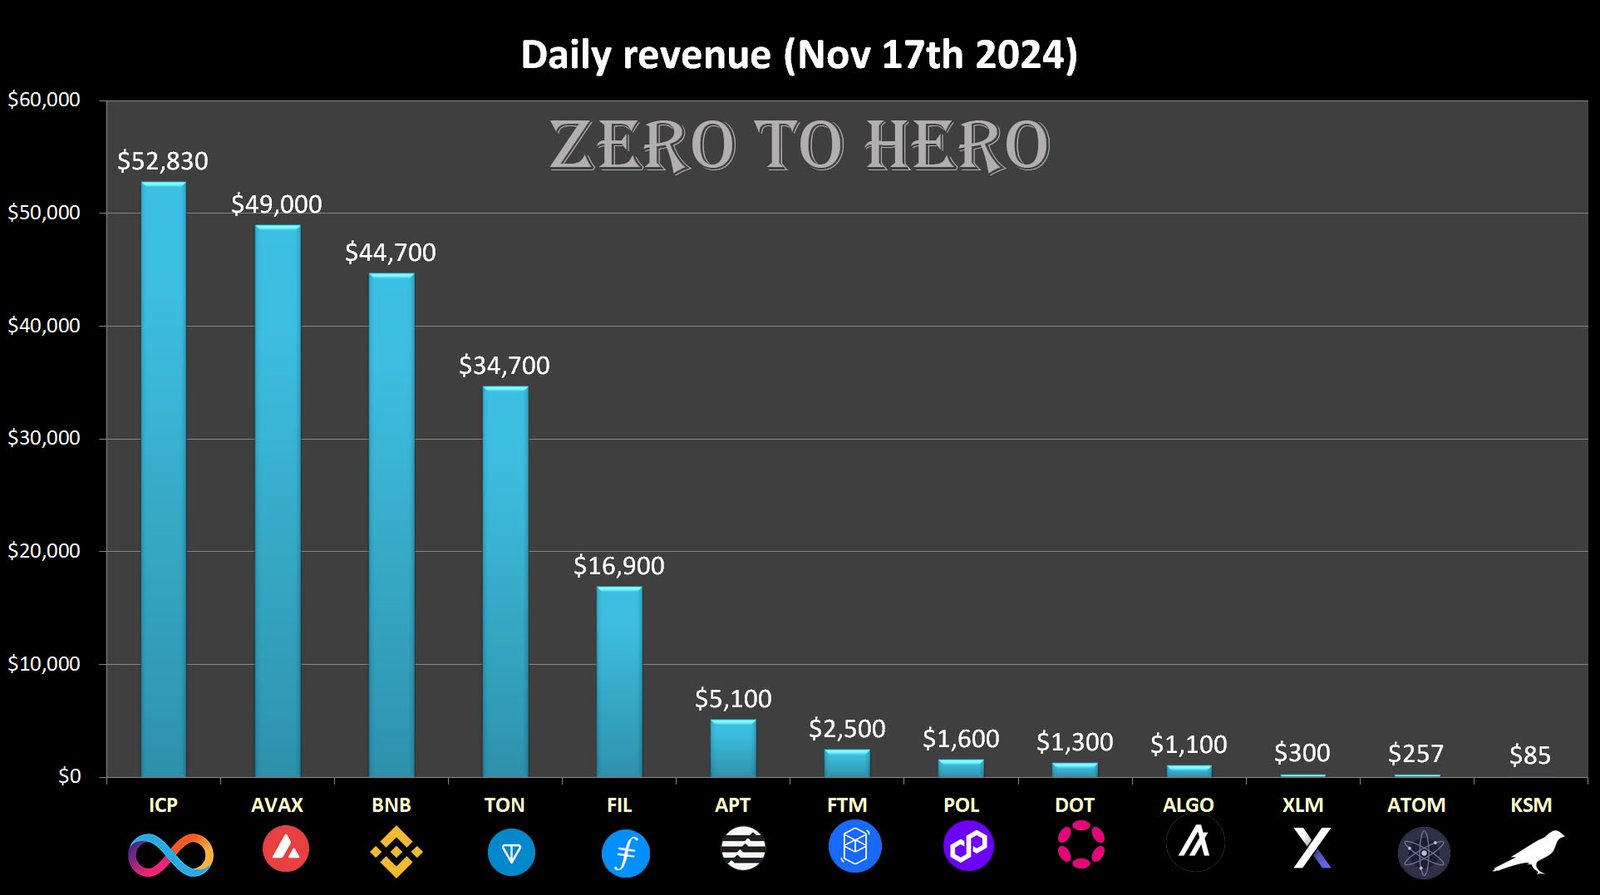
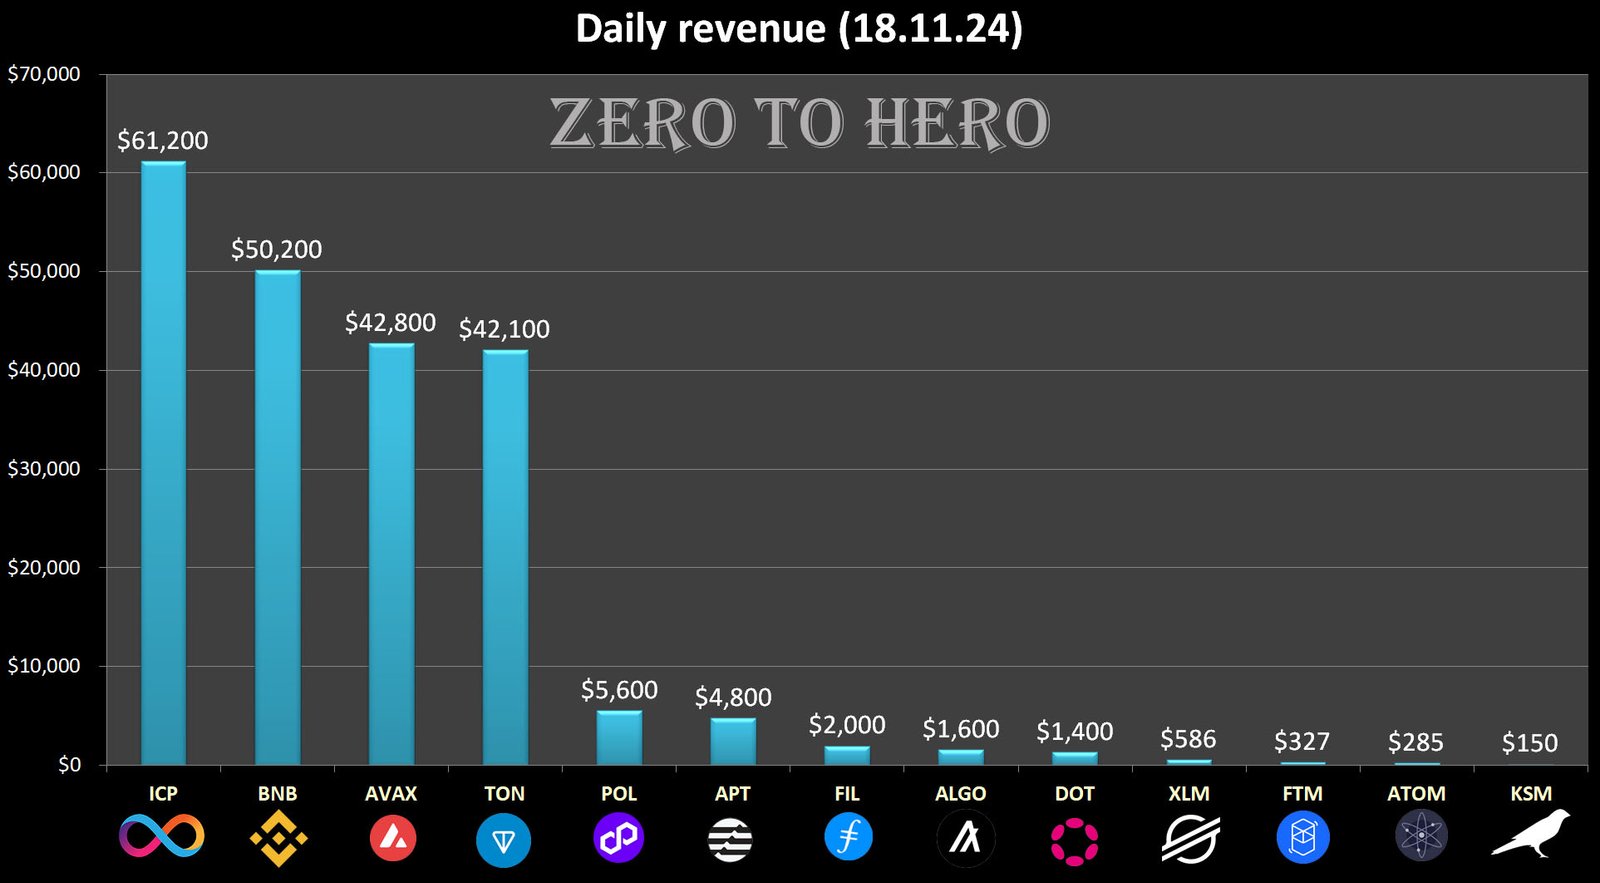
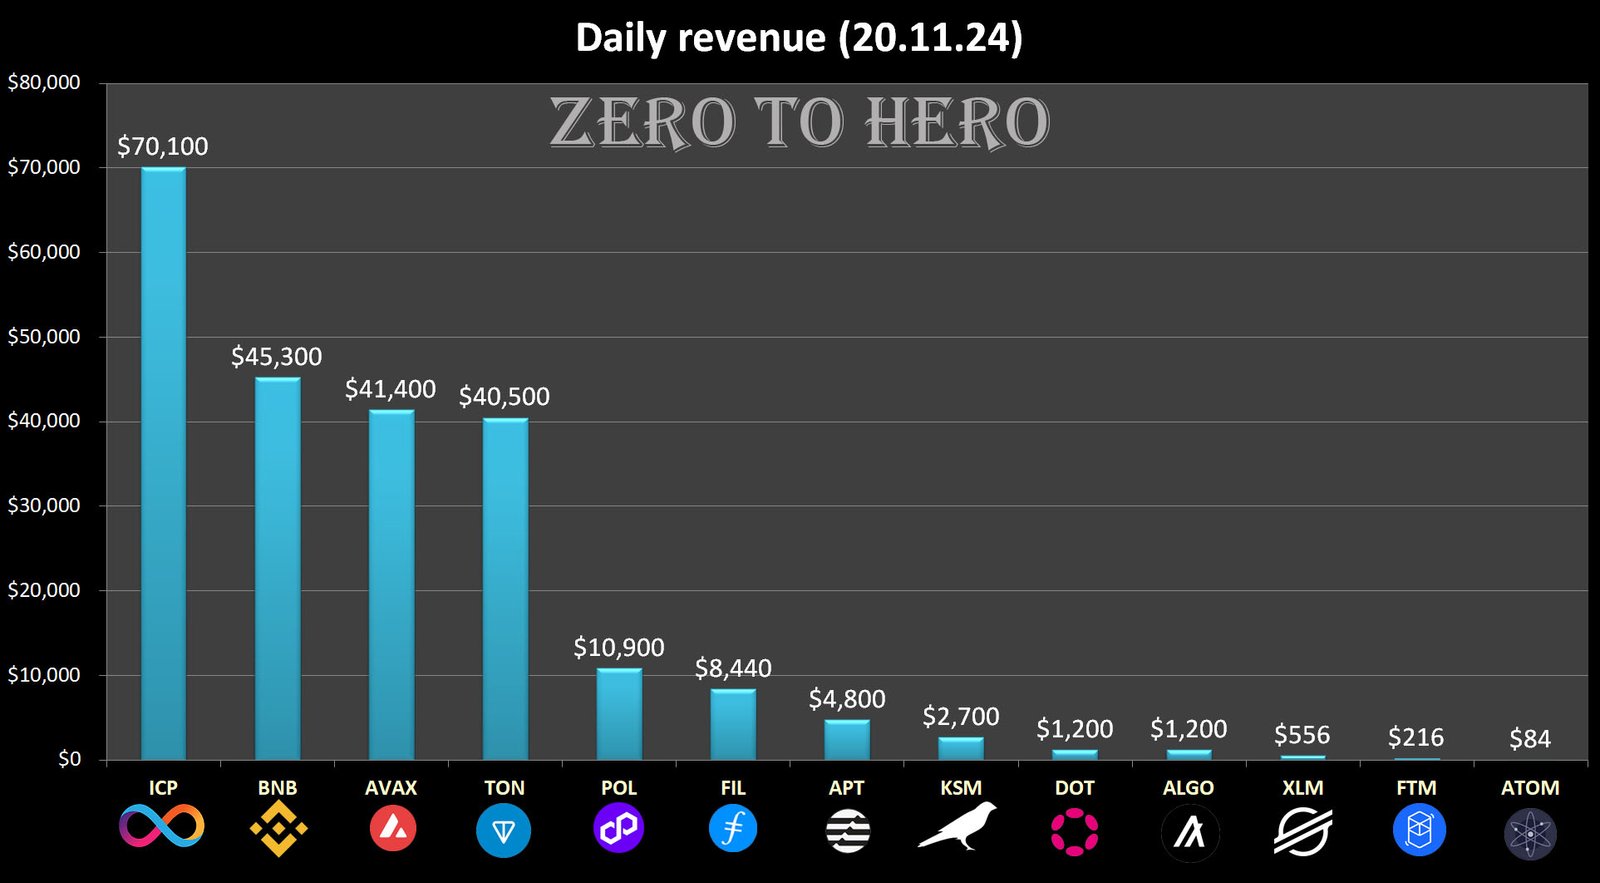
Over the past six days, Internet Computer (ICP) has ranked as the top revenue-generating Layer 1 blockchain (with a market capitalization under $100 billion) on five out of six occasions.
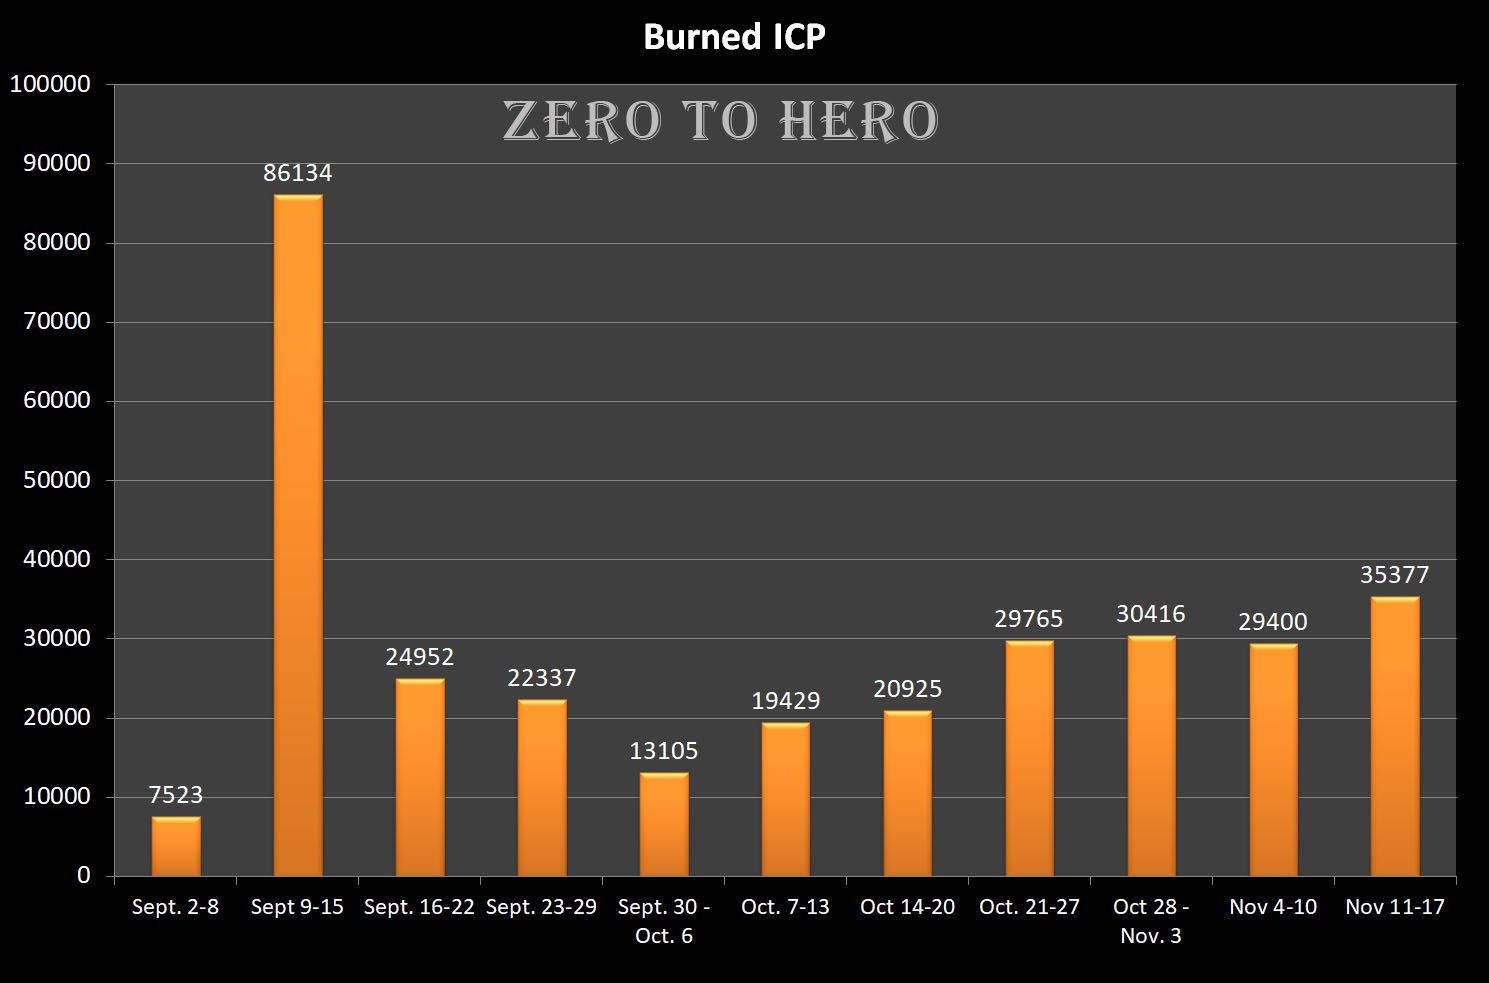
The significant increase in revenue and fees generated by ICP over the past three months can be attributed to a sharp rise in the cycle burn rate. Since the beginning of September, an impressive 347,500 ICP tokens have been burned, reflecting heightened activity and adoption within the network.
Here is the weekly comparison of ICP burned since the beginning of September, highlighting trends and changes over time.
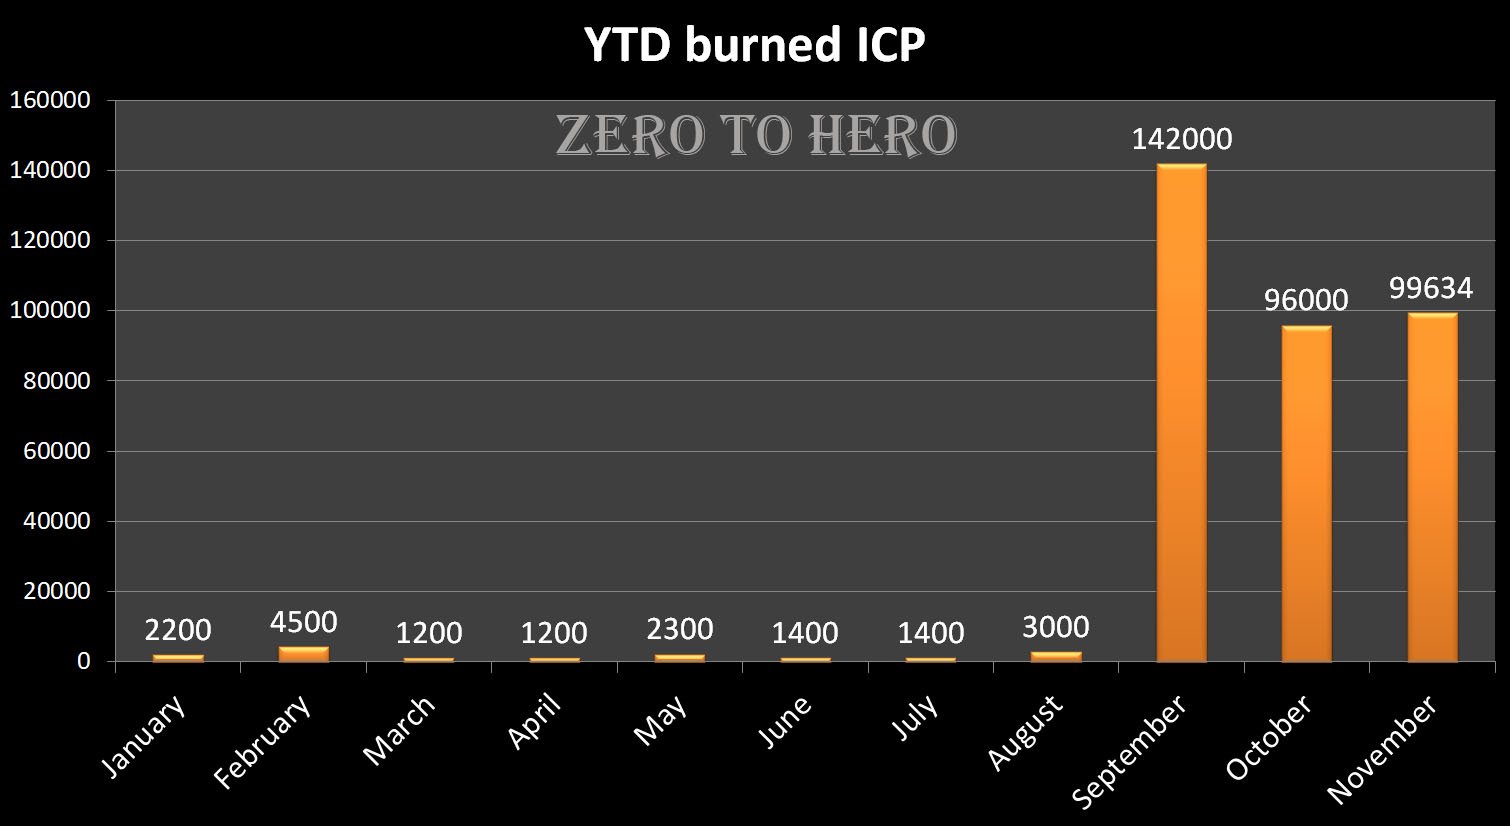
This is the YTD comparison of the burned ICP:
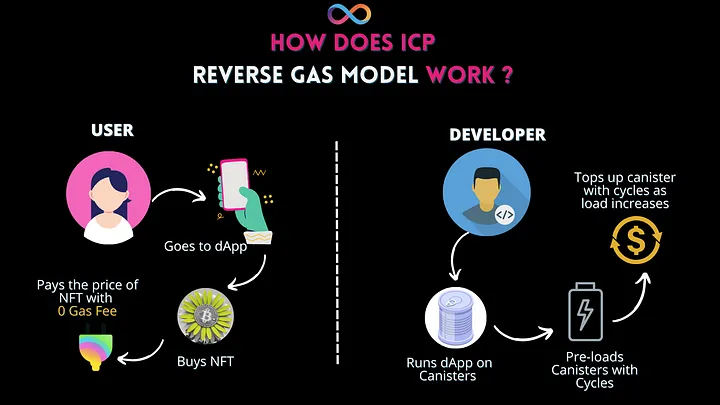
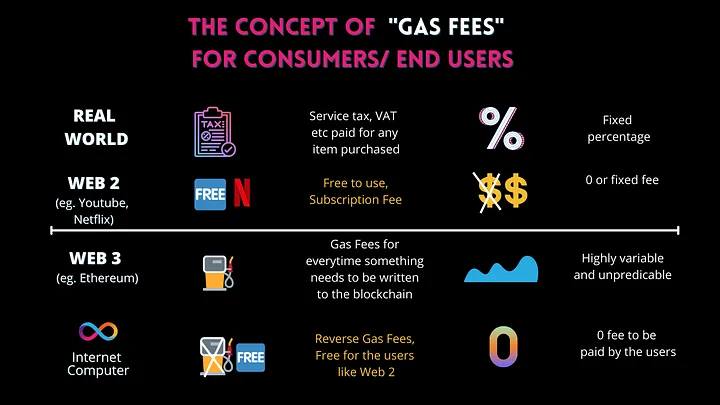
Fees and Revenue: ICP employs a unique “reverse gas model,” where developers prepay for computation and storage by converting ICP tokens into cycles. This approach allows end-users to interact with decentralized applications (dApps) without incurring transaction fees, enhancing user experience and promoting adoption.
Earnings and Expenses: Developers incur expenses in the form of cycles, which are consumed based on the computational and storage resources their applications utilize. The cost structure is designed to be predictable, with cycles pegged to a basket of fiat currencies, ensuring stability despite fluctuations in ICP’s market price.
Node providers, who supply the infrastructure for the network, are compensated in ICP tokens. Their remuneration is determined by factors such as node location and hardware specifications, aligning rewards with operational costs.
This financial framework fosters a sustainable ecosystem, balancing incentives for developers, node providers, and users, thereby supporting the growth and scalability of the Internet Computer.
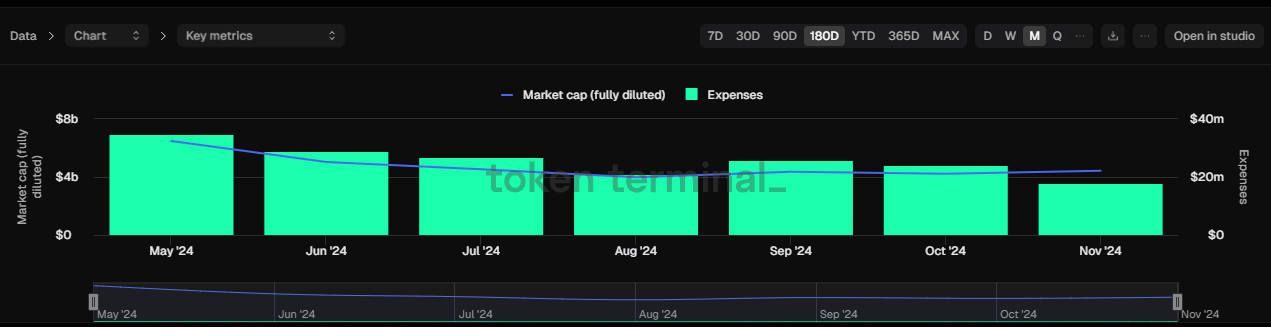
When analyzing the expenses for ICP, the graph below illustrates a clear downward trend over time. In May, ICP generated $34.7M in expenses, while in October, this figure dropped to $24.3M. This decline highlights the network’s growing efficiency.
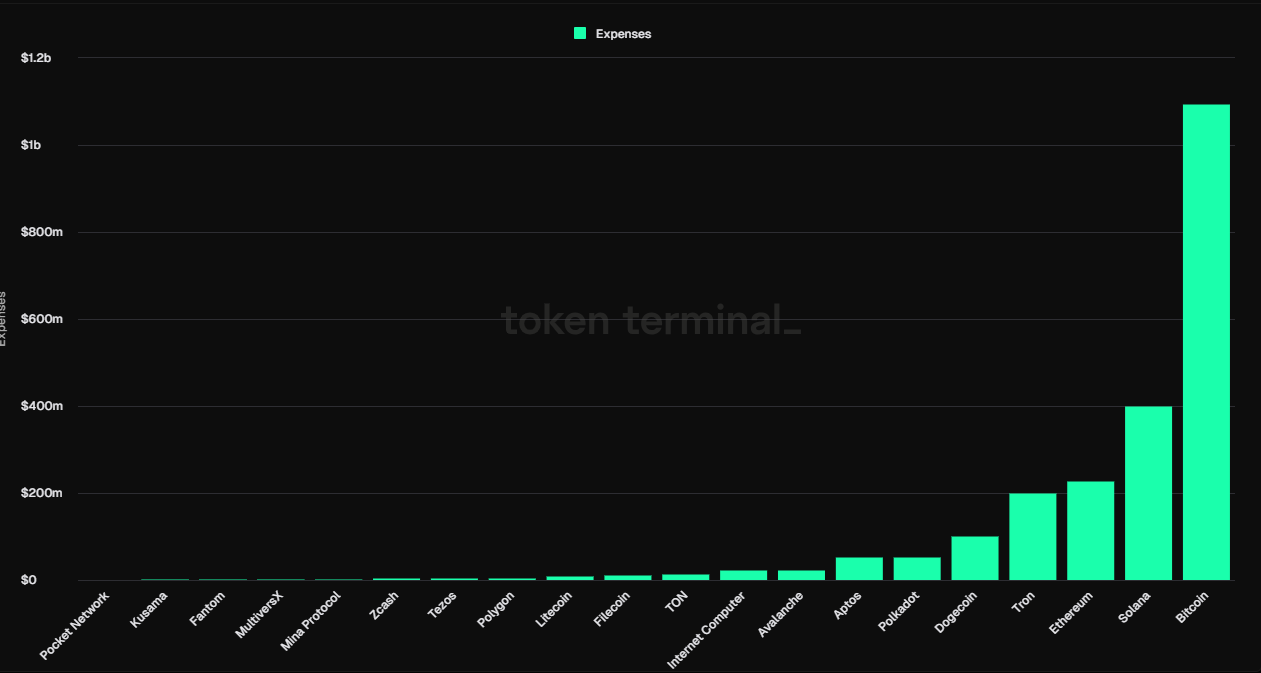
In comparing the expenses of Layer 1 blockchains, it’s important to note that drawing parallels between ICP and significantly larger projects such as ETH, SOL, and BTC may not provide a fair assessment due to their much higher market caps. A more equitable comparison would be between ICP and AVAX, as their revenue and expenses are quite similar. This comparison allows for a more balanced understanding of ICP’s financial performance relative to projects of comparable scale.
Overall, this analysis demonstrates a clear trend: the revenue and fees generated by ICP are steadily increasing, while the blockchain’s expenses are decreasing over time. This trajectory highlights a more sustainable and efficient project, positioning ICP for long-term growth and stability in the blockchain ecosystem.
Leave a Reply